Self explanatory short from daily resistance

AEM


AEM leaving money at the table
ACM short same as AEM
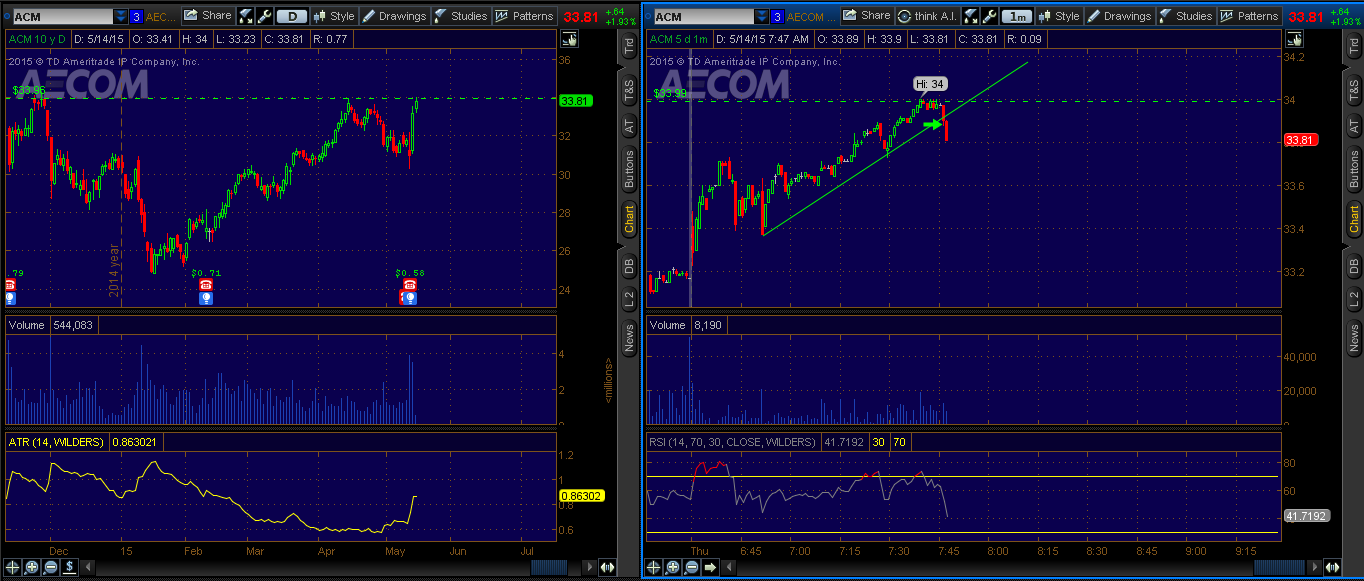

ACM cover 33.60 for 28 c gain risk 12c

ACM probably will leave money at the table here too
CMCM short 29.49 cover 28.50 Risk 30 c gain 99 cents
CMCM is near to but not exactly to major daily resistance . so I'd say riskier but stop is in place

CMCM ss 29.49
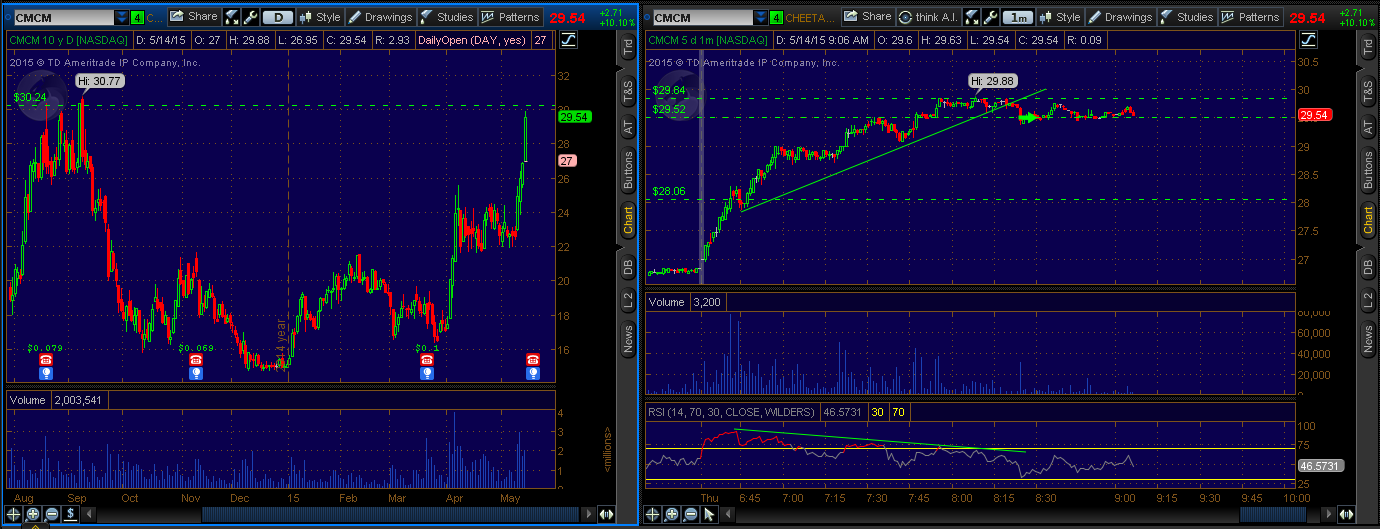
CMCM stubborn longs

CMCM the cover for 29.49 to 28.50
OSK short 55.16 to 54.80 Risked 15 cents for 36 cents gain
Last trade. I was hesitating to take it, I wanted to have 3 clean winners but hey 4 is always better :)

OSK ss 55.16

OSK cover from 55.16 to 54.80 Risked 15 cents for 36c gain
NOTE;
Not much to note here except the patience to avoid the not so good set ups. I waited to get the best ones and I did not rush to get in trade till I saw a good confirmation.
I been reading your blog since a few months, I'm completely new at trading, learning for myself, I'm about to fund and account on ST but what I still can't figure is to setup a stock scanner to catch momo tickers early . My target are $.80 to $4.00 usd stocks on the long side because small account. What would you recommend?
ReplyDeleteI been reading your blog since a few months, I'm completely new at trading, learning for myself, I'm about to fund and account on ST but what I still can't figure is to setup a stock scanner to catch momo tickers early . My target are $.80 to $4.00 usd stocks on the long side because small account. What would you recommend?
ReplyDeleteWell, if you know what set up you are exactly looking for , it will be easy to scan for it. I find the most powerful and easiest scanner to be TC 2000, since you can define almost anything you need to find. An example for momo trade long, would be a stock that has been having lower lows 3 days in a row, into major daily resistance ready for a bounce. It is very easy to formulate the scan in TC 2000. H3<H2<H1 which stands for each day has a lower high then the prev day , and L3<L2<L1 meaning each low of day is lower then prev day low. There is daily and intraday ways to scan based on the candle configuration , and anything else you may want to scan for. It is $100 monthly fee for intra day , or $30 for end of day data. I also use Trade Ideas , Finviz.com ...but I try to keep very simple scan process , mostly finding the biggest movers and from there finding manually supp and res and so on . Hope this helps .
ReplyDelete