To understand the concept of finding a good moving stock lets look at few charts in hindsight first.
What is common for all these movers: The strong above average volume. The volume is fuel to move the stock just as more fuel is needed to move the car over the hill.
Fact is any stock that has nice intraday move could be tradeable,( speaking of daytrading) such as for instance a stock that has ATR of $1 or bigger. It can be nice directional move or it can be choppy. To make money in directional-momentum move seems to be easier , although making profitable trades in choppy stocks is also possible by implementing tactics which requires different approach ( almost 180 degree opposite approach of the trading the momentum directional move )


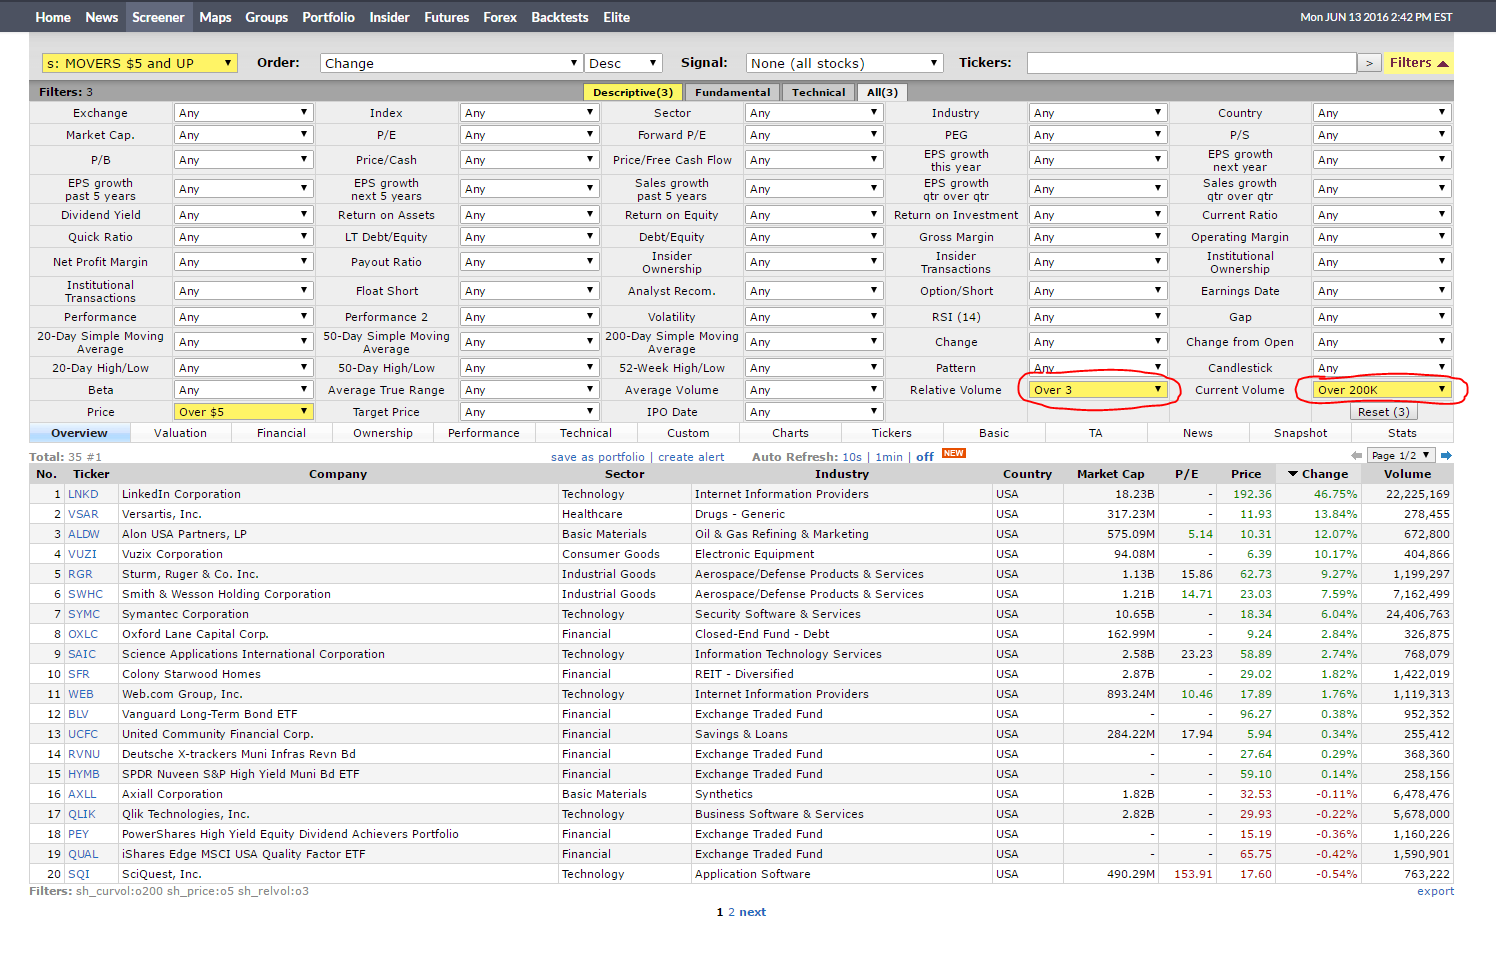
It is simple and clean. Now it is all up to which stock I select to trade. Quick view of their daily chart helps a lot in finding a stock with the least resistance above ( if long ) or below ( if short )
You can either scroll by hoovering above the symbols or click chart view which will display all daily charts.

From here it is all about focusing on only few, the ones that you may think are the best, since trading everything is not easy at least not easy for me. I'd rather stalk my symbols for the day then jump on many new ones just because I had to take some losses. Weather I will just get in and trail the stop as the stock moves or I sell the pops and buy the dips , it all depends on how the stock is trading. I love to only trail the stops below. but there are I think more cycles when it is better to sell the pops and re-buy the dips.
Hope this may help.
Have a happy trading
AngelDan@DaChopa