My name @DaChopa comes from being chopped out so badly for many years by the markets. I just share my experience real time to save sheep from being taken to the slaughter house.Do not copy my trade alerts.Just watch me trade live and understand the concept. Play small if you are new, very very small just to be in the game long enough to learn it. The only way to learn it is to stay in the gladiator arena long enough.You are entering a losing game before you plan to have any steady profits.
Great Savings
Monday, April 13, 2015
Apr 13 How I use RSI on ADXS AMCN ADMP ORMP even SPY
ADXS
When the stock is not at a daily level that I like it to be in order to short it, I may use RSI to help me time the short entry. In this case ADXS has not arrived to any daily overhead resistance , ( it makes all new highs). It is definitely overextended but guessing the short is not that easy and I may get squeezed many times till I nail it. So using the divergence in the RSI for me works quite all right.
DIVERGENCE means the price of the stock, the trend of the stock is opposite of the RSI trend for the same time frame as shown on this chart ADXS.
ADXS RSI divergence pointed a prefect short today
ADXS at EOD update
More precisely said: At the points where ADXS had same level double tops, the RSI did not have same level double tops. The RSI had lower highs which is opposite of the double tops on ADXS. That is the divergence. Draw the trend line on the RSI connecting the lower highs and draw a trend line connecting the highs of the ADXS price chart
The entry is at break below the lower green trend line on the 1 min chart in this particular case
AMCN
Similar to ADXS , AMCN did not get to my desired daily level of 3.70 ( daily swing high from last week). So what do I do then? I'd rather wait to get to 3.70 but the temptation is high that sometimes I have to trade. But if I have to trade , at least I will trade by certain rule and tool I keep in my trading arsenal. There is the divergence clearly drawn on the chart below.
AMCN RSI divergence
AMCN at End Of Day
I always put my daily chart so I can see it and know the daily main pivot points. Those are the levels of my prime , MY MAIN interest. It is so important for me, like using the rear view mirror when driving a car and changing lanes. I just can not trade without daily chart open at all the time .
AMCN will definitely be on my watch tomorrow for possible short 3.70 all depends on how it will trade and the entire price action around that level, how it will get there , how will act there and so on.
ADMP
Same as the two above ADMP ( not trade-able due to big spread for me ).
The only difference is ADMP had nice overhead daily resistance 5.18 area.
RSI divergence , break the red trend line is entry short and risk reward favorable too.
ADMP daily resistance AND RSI divergence
ADMP at EOD update bad spread all day
SPY
Using confluence when trading is very important.
SPY collided into the daily descending trend line today.
( I AM SO INTO THE DAILY LEVELS AS MY MAIN PINTS OF INTERESTS)
RSI divergence is happening at the same time intra-day so I have :
CONFLUENCE of two major factors (this is my trading opinion, works for me)
Even the SPY which I hate to trade because of so much choppiness gave a nice short today.
SPY daily is left , intra-day is right
ORMP
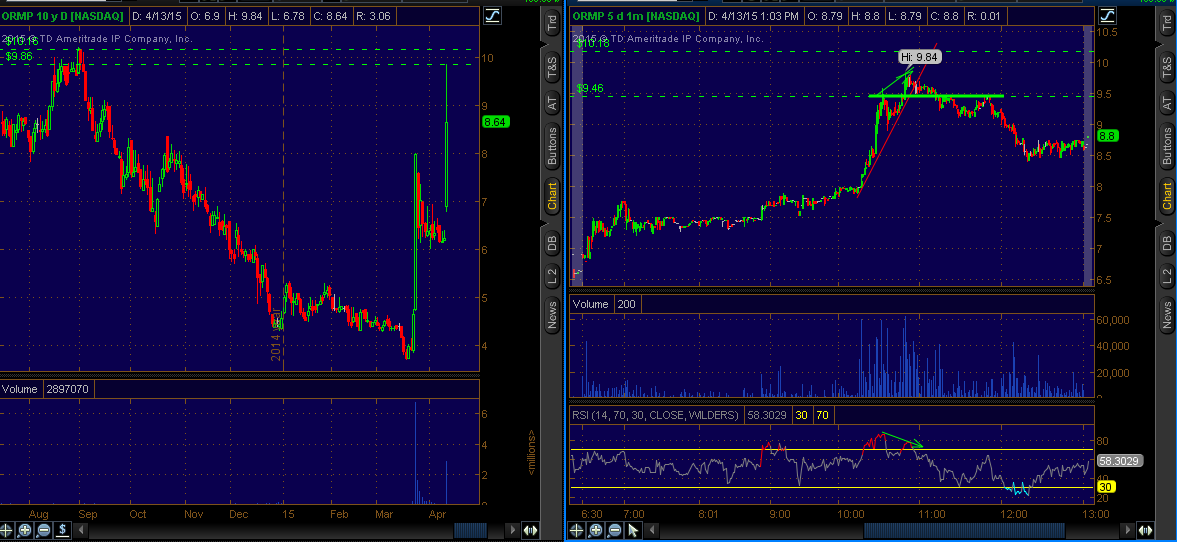
I will rather short it at 10.18 daily main resistance but here is not bad risk reward. I can always enter and exit immediately if I am wrong. I keep in mind it can easily run to 10.18 so being ready to exit at the first sign that I am wrong is very essential.
ORMP the plan
ORMP the RSI divergence in effect
ORMP EOD update
It was a nasty fade, risk reward well worth it this time but it is not always as easy as it was today. I think having the SPYs fading all day from a major daily resistance contributed for this short to work flawlessly.
Stay disciplined and stay green !
Salute !
Subscribe to:
Post Comments (Atom)


No comments:
Post a Comment